


LENDERS
Knowledge is power.
when utilized.
Our Intel Dashboards is an advanced analytics tool that helps Lenders harness SBA lending intel to close more loans, make more informed decisions, market with more precision, and view risk multi-dimensionally.
Intel Dashboards were engineered to be used by everyone on the Lender’s SBA team.
They’re easy and intuitive to use.
Select the dashboard report, select any filters you want to use, and interact with the intel.

Salespeople sell what they know and SBADNA helps them know more about the SBA lending landscape in their market. Discover business development opportunities both locally and nationwide. See what and where competitors are focusing on and moving away from.
Precision market research for where to market and who to target based on trajectories and forecasts. Research from a nationwide macro level down to specific borrower zip codes. Examine current and new markets, competitor focus, and analyze industries, franchises brands and markets.
View risk through the prism of multiple filters and timelines to gain deeper insights. Macro and micro risk assessment from historical, trending and forecasted perspectives. Utilize data for more informed credit policies or for an individual loan under consideration.
See the difference it makes when your managers are able to keep their finger on the pulse of local SBA activity. Enables competitive intel of lender competition targeting their area, the hottest trending and forecasted industries and franchises, and to discover opportunities.
BDO’S & LOAN OFFICERS
THE PULSE OF SBA LENDING

Quickly find the ranking, activity, trajectory, and forecasts for lenders, industries, franchise brands, and geographical areas…in any combination

Our snapshot report gives you a snapshot in any SBA lending timeline.
This report offers one place to find a summary of charts showing maps, loan amount tier charts, historical and projected activity.
Get the SBA 7(a) lending summary snapshot for any combination of filters and time periods.
See nationwide for everything all-time, or filter for the industry, franchise or market area you’re responsible for.
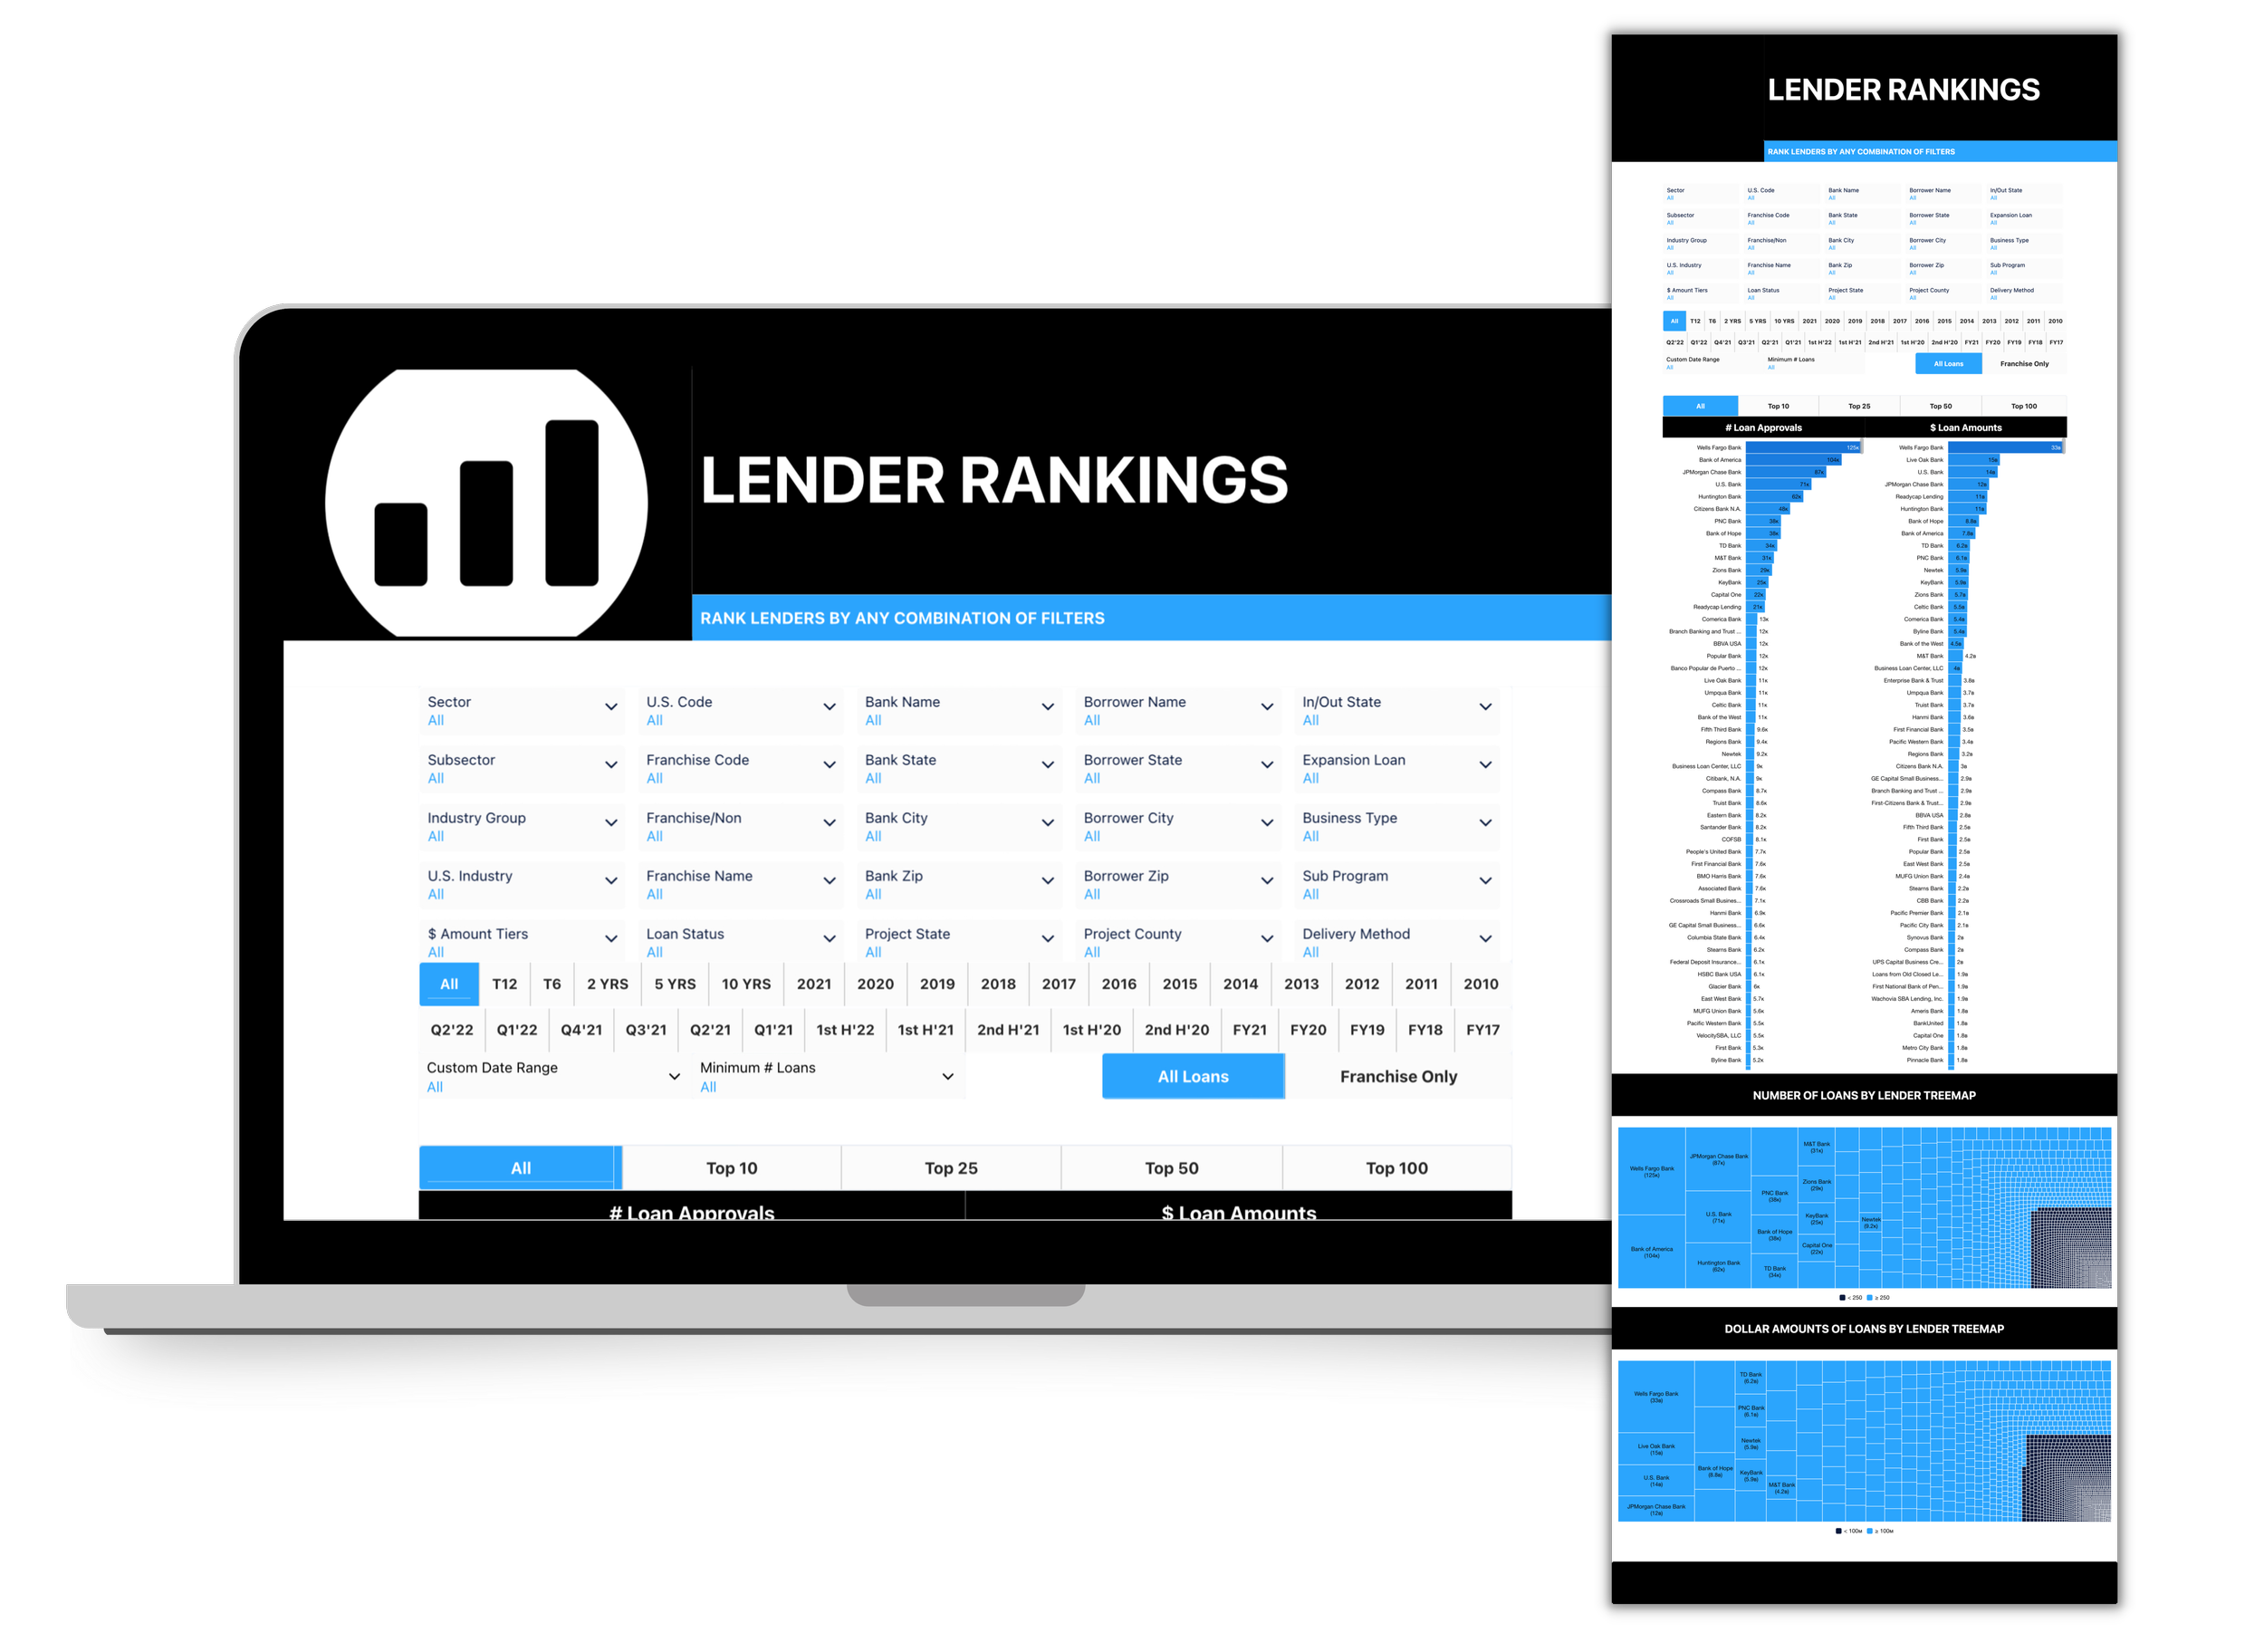
RANKINGS & MICRO RANK
How does a boutique SBA lender compete in rankings with the giant national top ranked lenders?
Even the playing field with rankings that match your specific target prospects.
Most business owners in your target market aren’t focused on who the top national SBA lenders in the country are.
Telling a restaurant owner prospect that your bank is a top restaurant SBA lender in your local market can have more impact than a general national ranking.
What is your bank a top lender for?
Check your rankings by business sector, industry, franchise lending, or a franchise brand can easily be searched.
Check your rankings for by region, state, county, city or zip code, loan tier amount, in any combination and time period.
WHICH FILTER COMBINATIONS DOES YOUR BANK RANK FOR?
( Click on Image to Zoom )
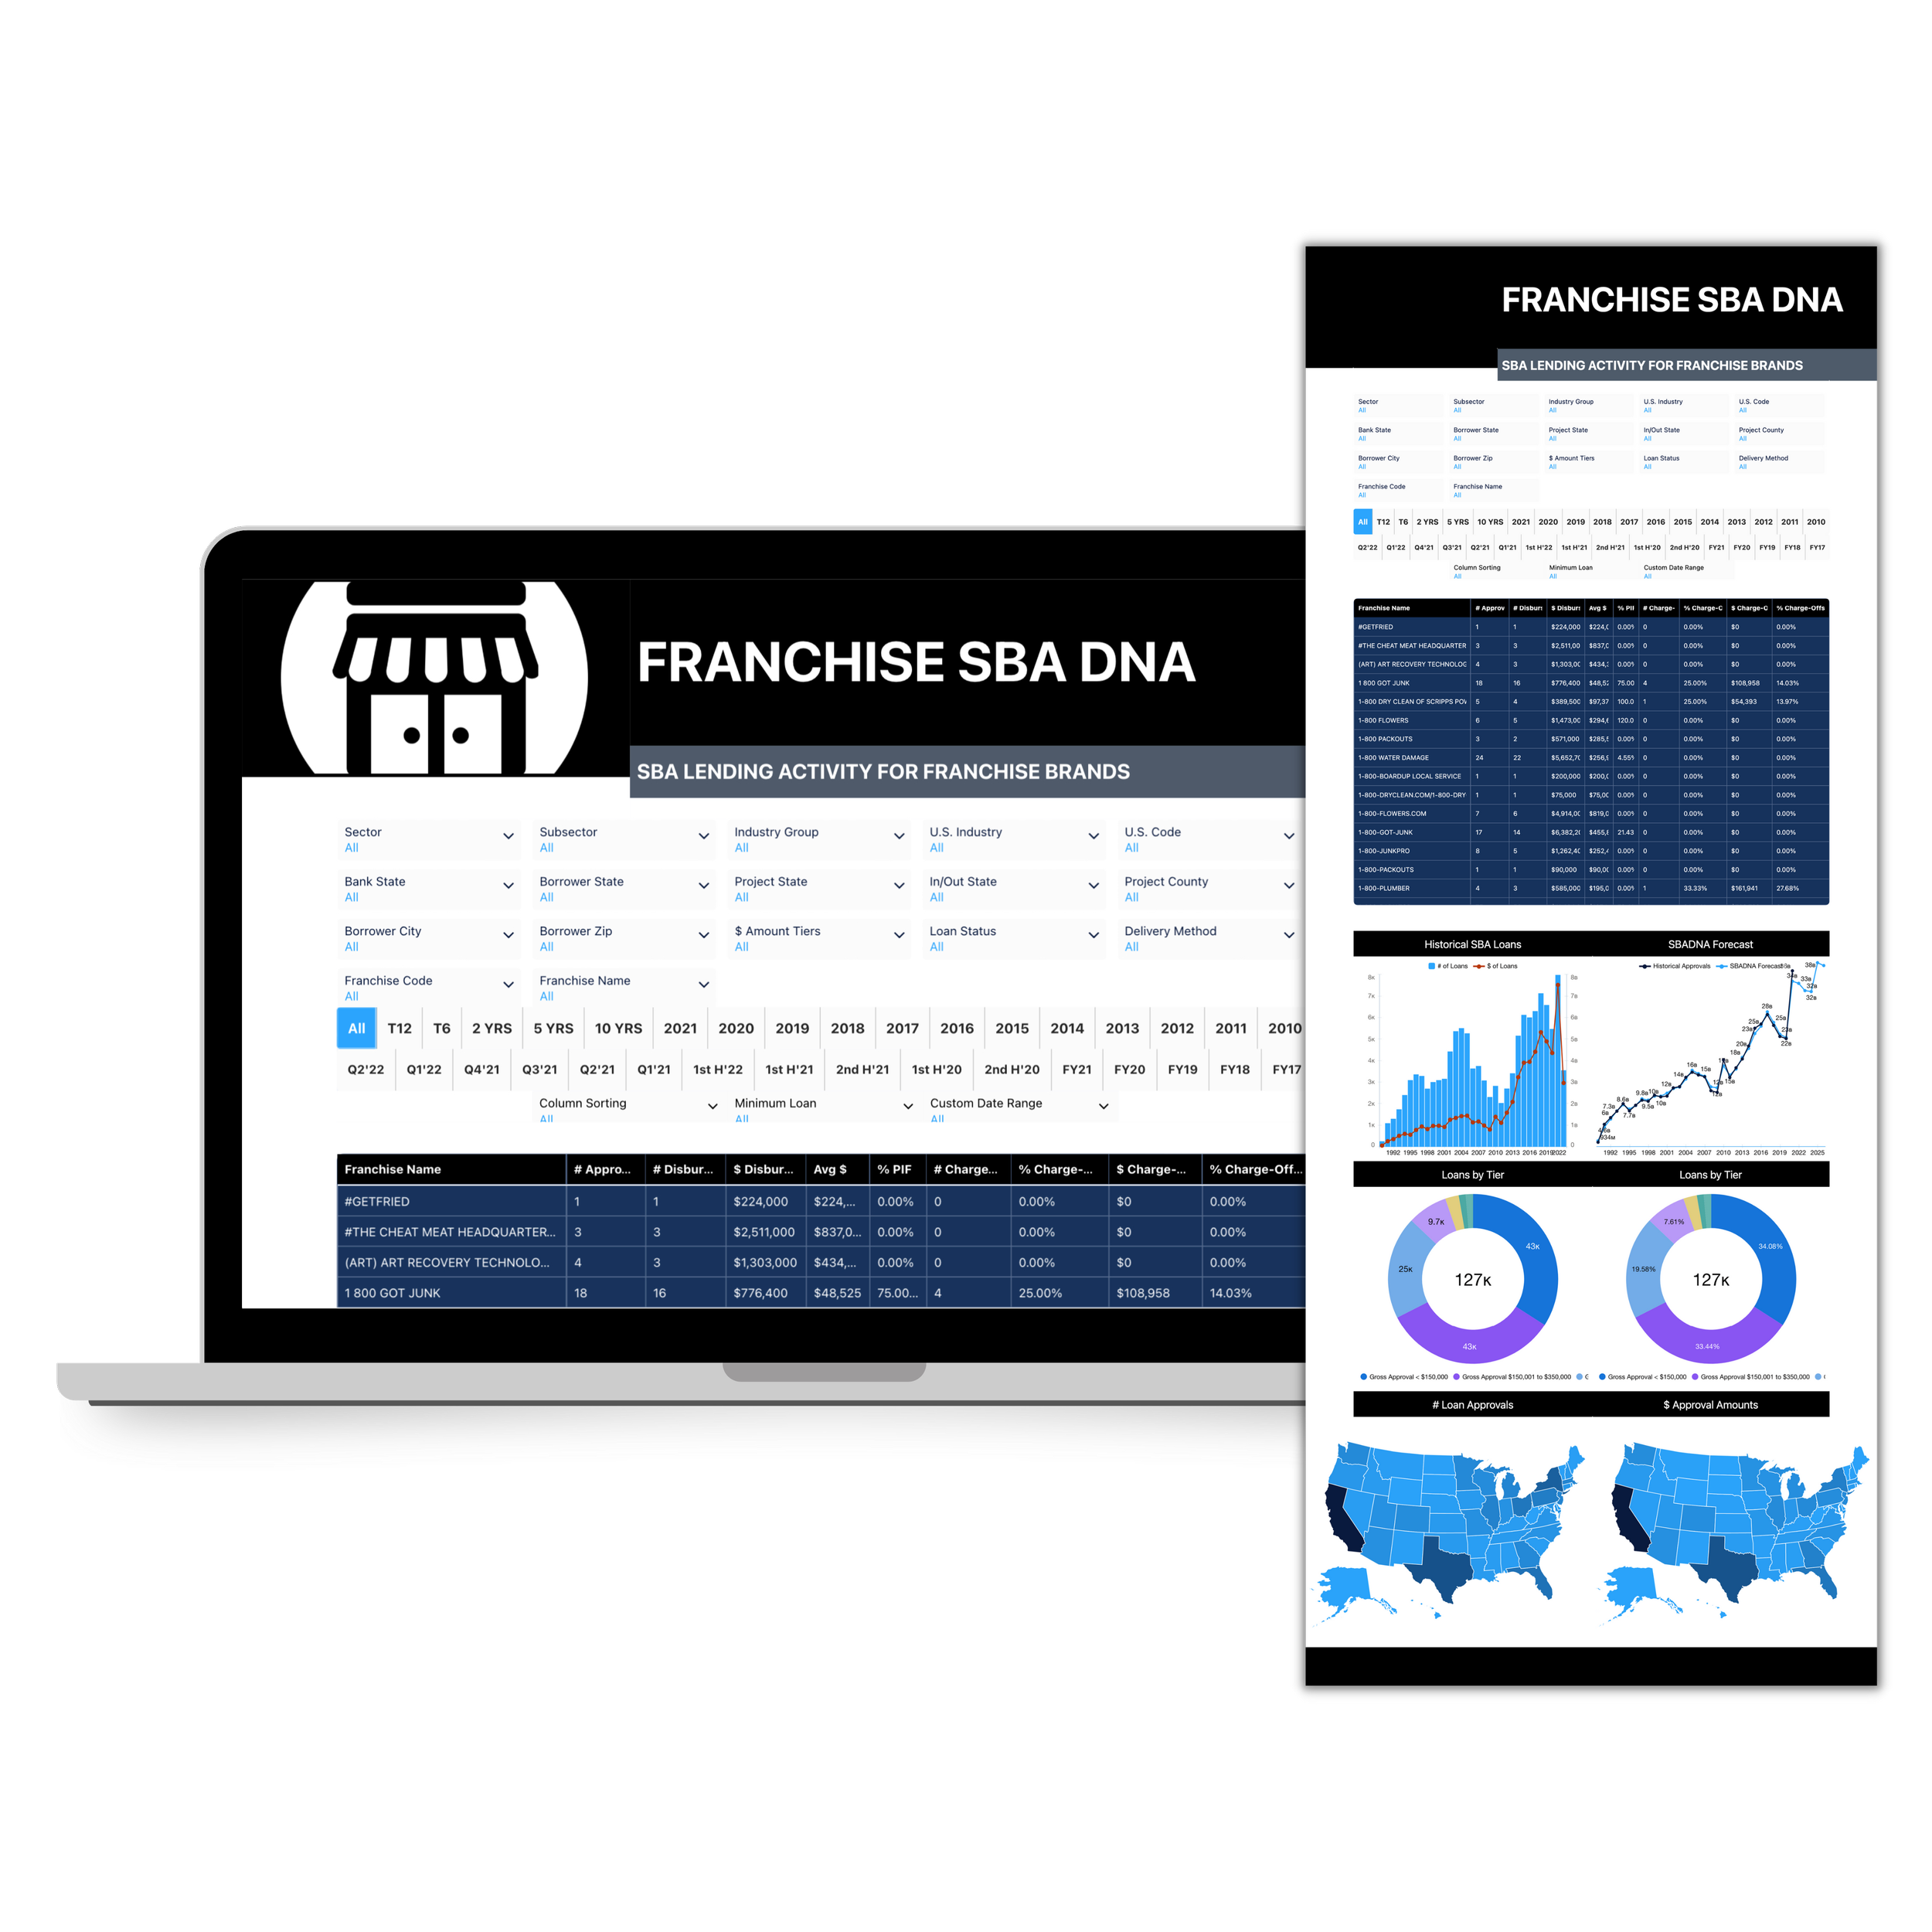
FRANCHISE LENDING INTEL

If you are heavily focused on business development with franchise branded businesses you’ll love our franchise intel.
Most all reports can be filtered for “franchise only” or for a specific franchise brand, in addition to the franchise-specific dashboards.

View franchise lending as a whole, a specific brand, a grouping of brands, and even compare brands side-by-side.
MARKETING TEAM
Predictive analytics identifies the hottest trending and forecasted industries, franchises and state, city and zip codes to target for SBA lending business development.
Research for national campaigns or pinpoint to the zip code.
Tailor different ad messaging and themes for key industries, locations, and franchise brands.
DNA-based Targeted marketing
( Click on Image to Zoom )
CLOSE MORE LOANS
See what the top SBA lenders and specific competitors are focused on that your bank isn’t.
Utilize micro rankings to counter top national banks in your market area and win more loans.

Research the top ranked industries and franchises by loan activity, loan amount tier, trends and forecasts for your geographical footprint.
View where the growth puck is headed in trending and forecasted SBA loan activity.
CREDIT & ANALYST TEAM
When it comes to finding charge-off data, you’ve never seen anything like this. Our proprietary charge-off dashboards allows for both a more holistic and detailed view of risk.
Go from different ten-year time periods and charge-off ratios almost instantly.
Use filters to get a more informed risk perspective.
Charge-off numbers and ratios for states, loan amounts, counties and cities, and in multiple combinations, can be significantly different than the national industry average.
MORE INFORMED RISK DECISIONS
( Click on Image to Zoom )
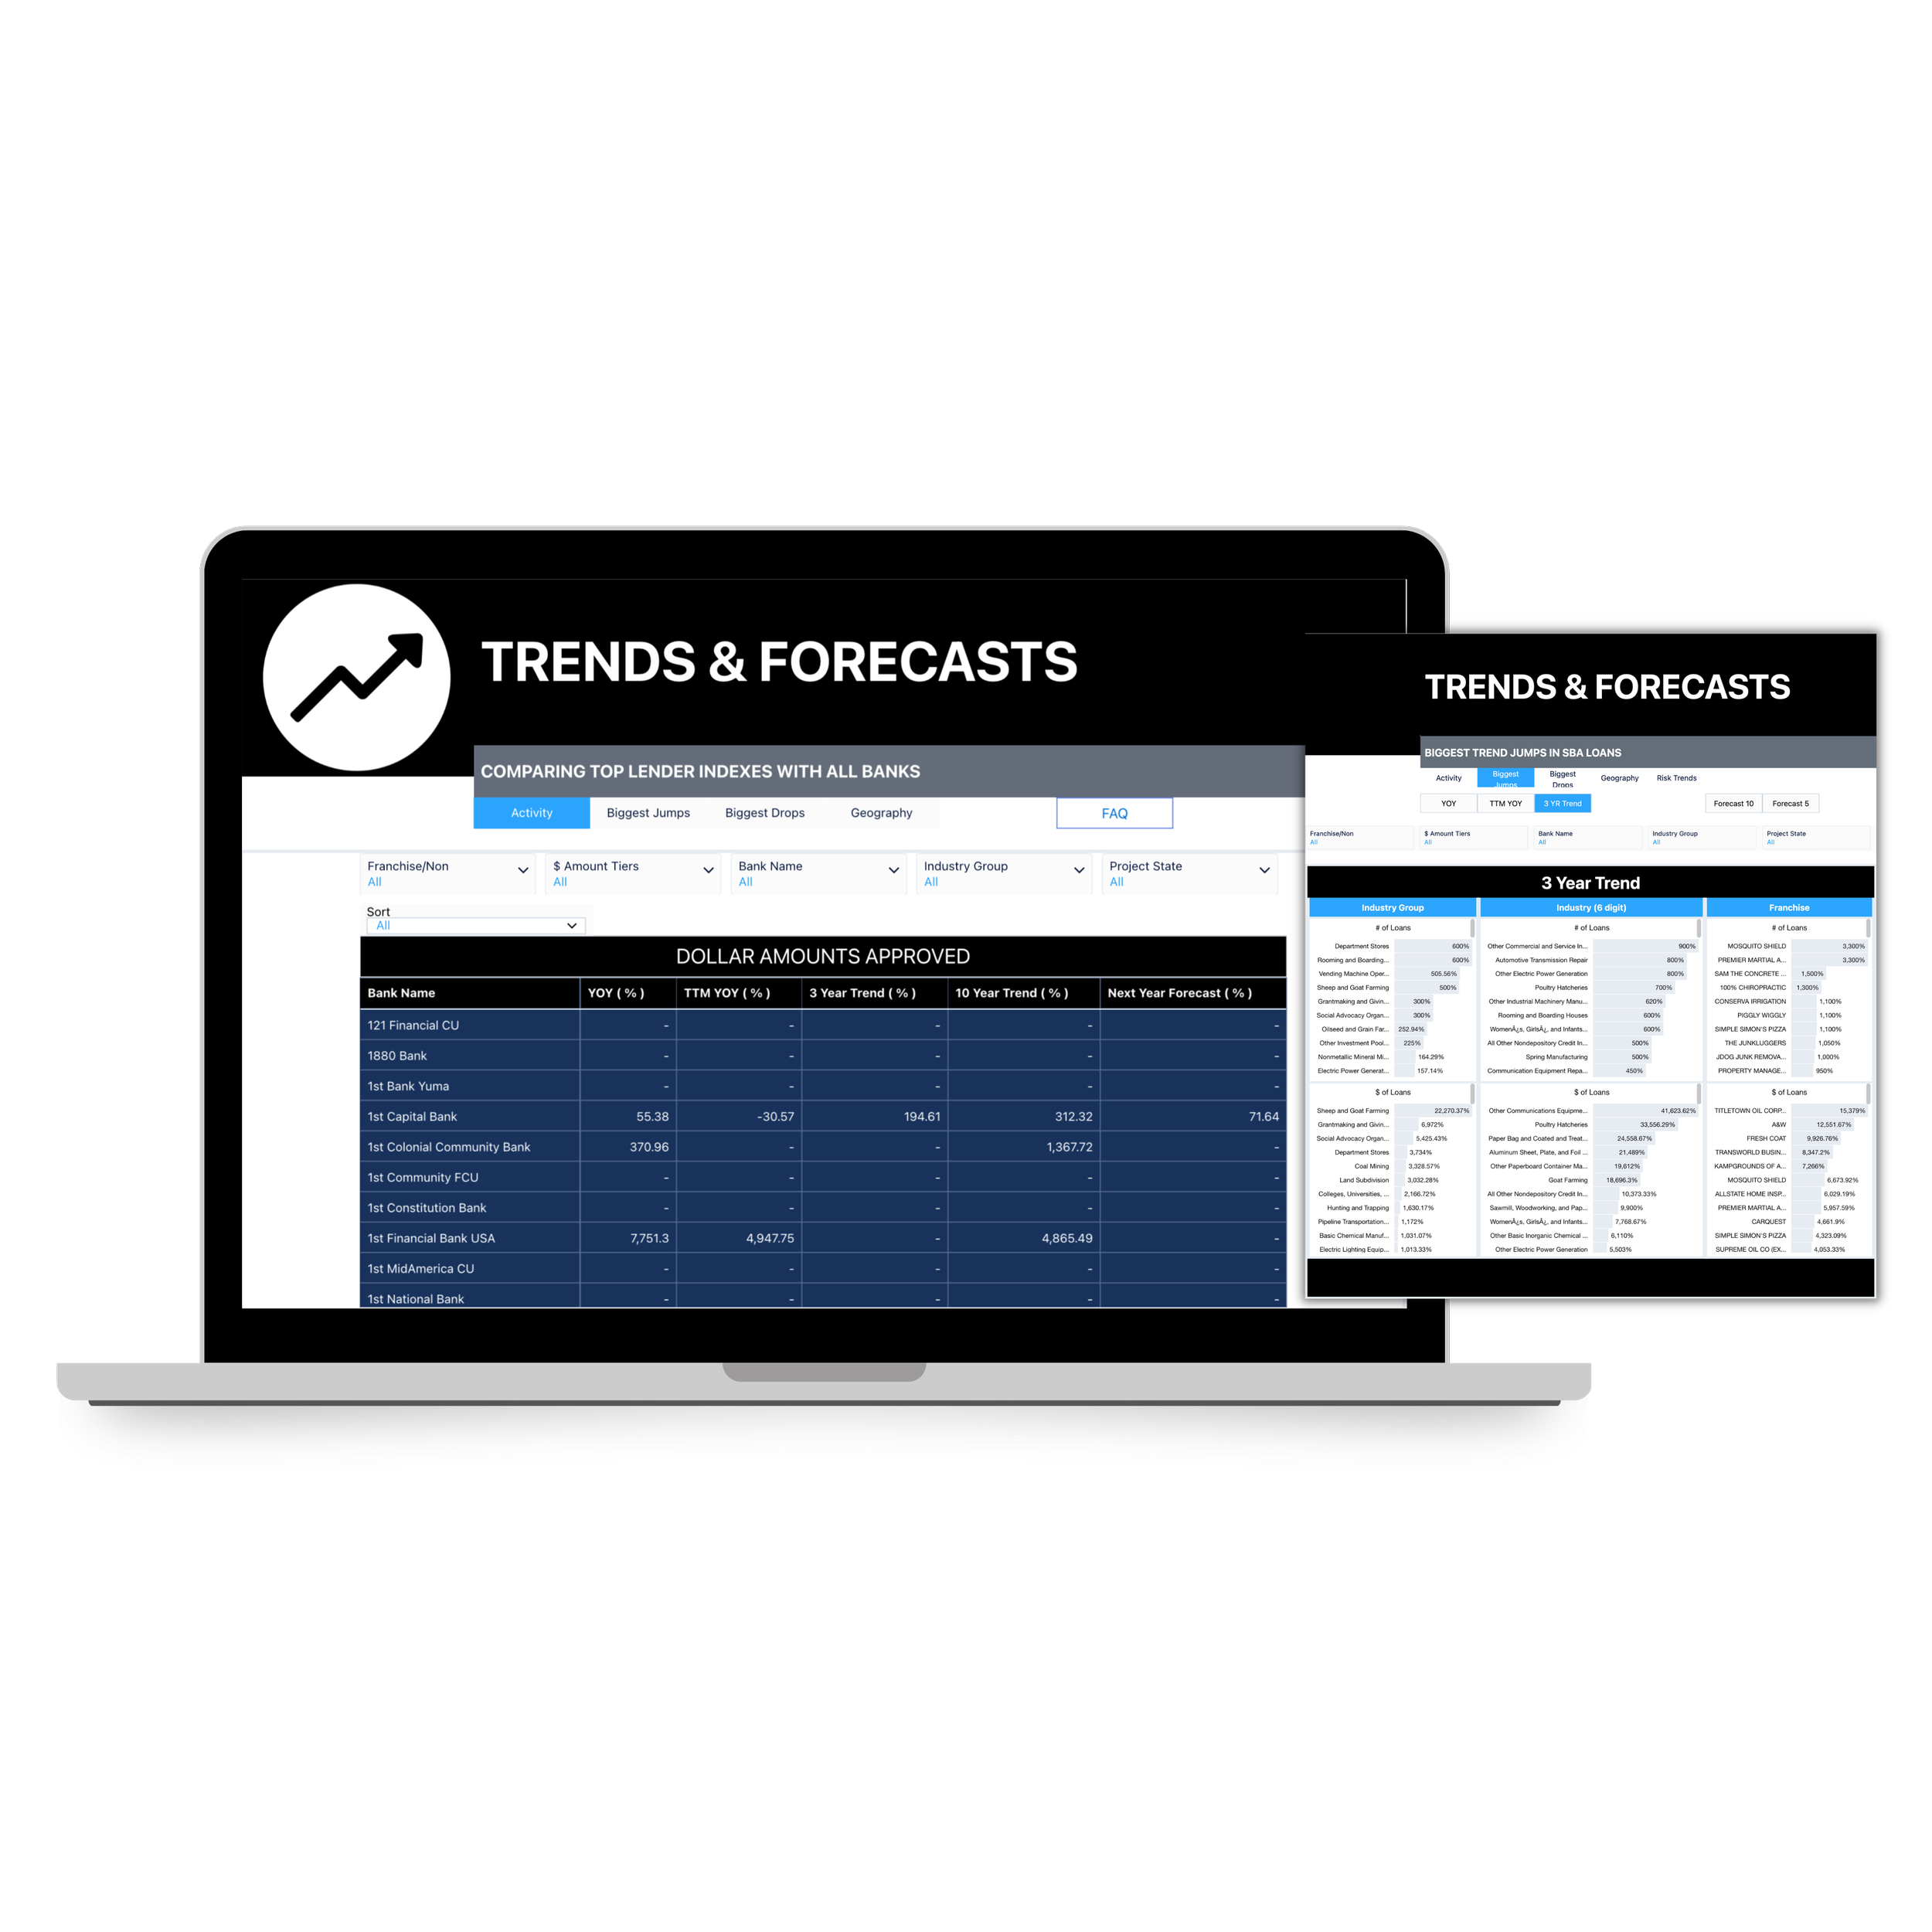
SBA TRENDS & FORECASTS

See the trends and forecasts Explore:
- YOY (Year over Year)
- TTM YOY (Trailing Twelve Months YOY)
- 3-Year Trend
- 10-Year Trend
- 5-Year Growth Trend Forecast
-10-Year Growth Trend Forecast
- Time Series Forecast Model

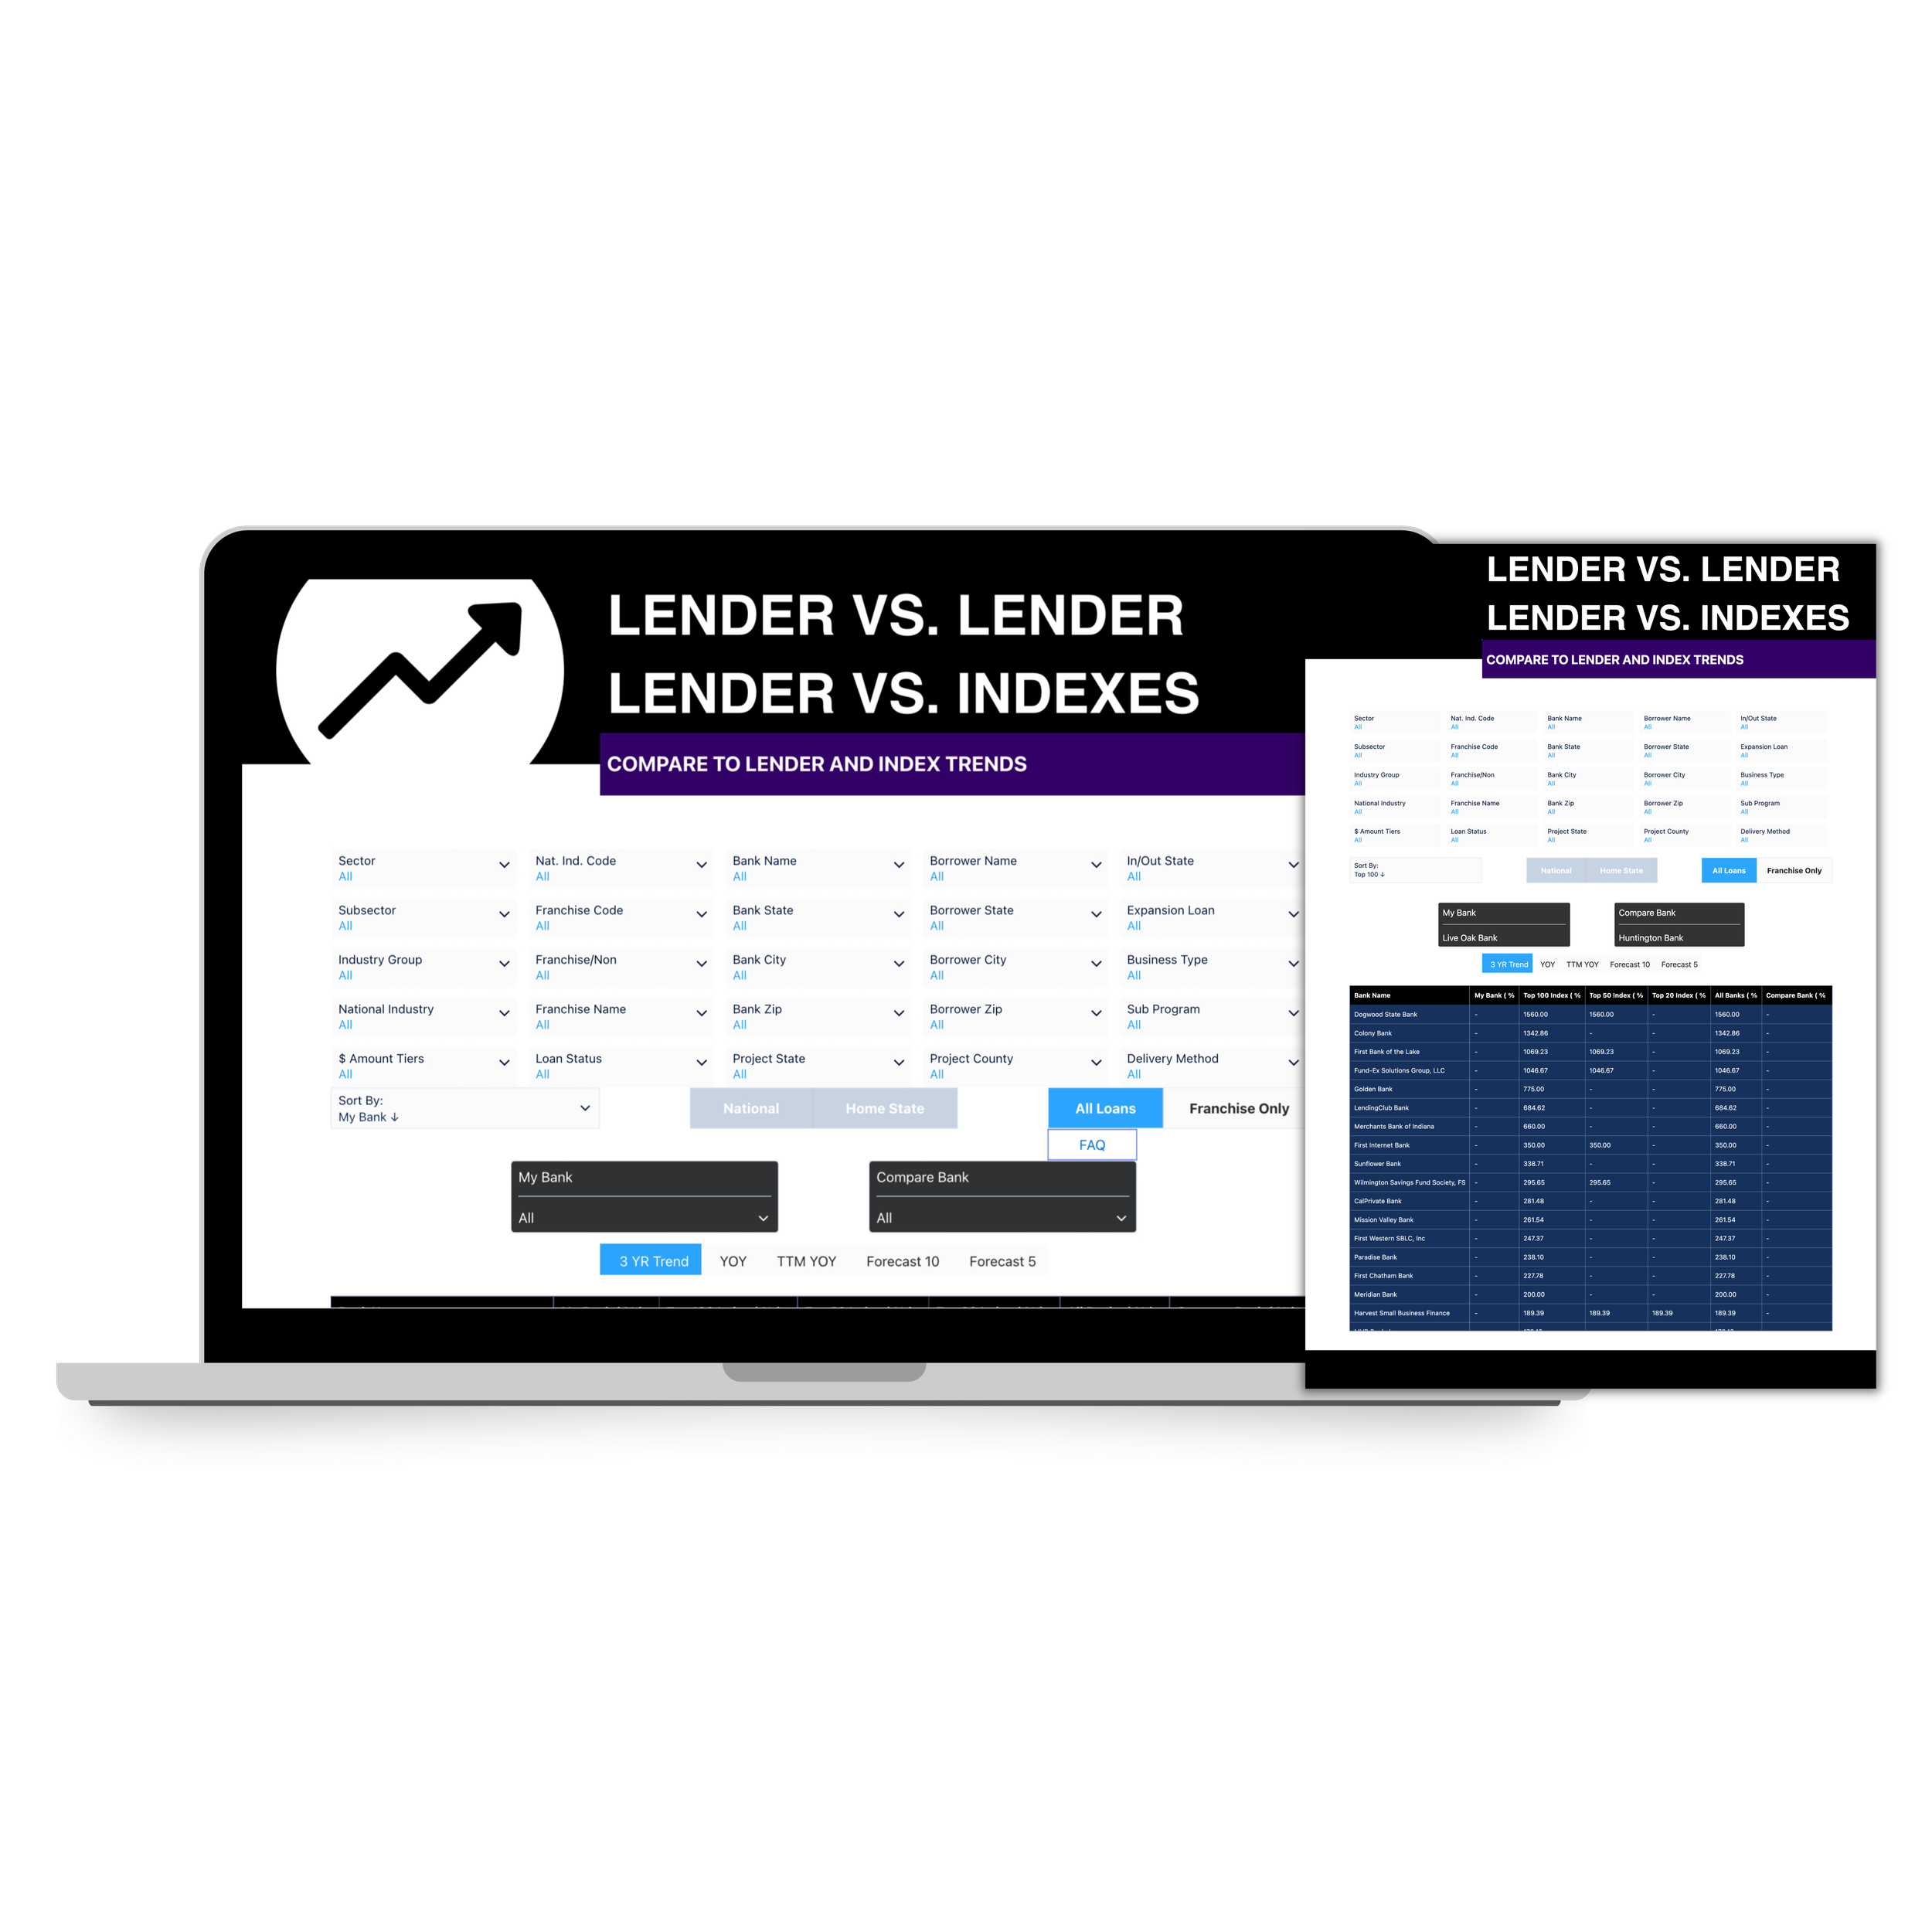
Benchmark against top lender indexes, all bank average, and another selected lender.

Benchmark against top lender indexes, all bank average, and another selected lender for project states and counties as well as borrower city and zip.

Benchmark against top lender indexes, all bank average, and another selected lender for franchise lending.
Branch & Regional
MANAGERS
Increase bank branch engagement with SBA lending by empowering branch teams with localized SBA intel.
DRIVE MORE BRANCH REFERRALS

Localized SBA intel
for branch market areas

SBADNA provides micro-level SBA intel for local SBA activity in the branch’s market area. Branch teams can view the rankings, competition, activity, trends and forecasts of SBA lending for the counties, cities and zip codes in their market area.
Branches become more aware and engaged in SBA lending with localized SBA intel. Empower your branches with a tool that crystalizes the SBA lending landscape, competition and opportunities for their specific target markets.

Knowledge is power, if utilized. Empower your branch teams with localized SBA intel. No training required to use SBADNA, just point and click to easily and quickly find answers to questions like:
• What is the SBA lending activity for everything in my market?
• What are the top SBA rankings for everything in my area?
• What are the hottest industries and franchise brands for my market area?
• Which SBA lenders are my biggest competitors for my branch area?
• Which zip codes should I be focusing on for marketing?

The SBA lending pulse
for bank branches

Good things happen when a branch team is fully engaged in their branch’s SBA lending.
Having awareness of the local SBA lending landscape fosters confidence and promotes more customer conversations about SBA lending.
If localized contests and recognition initiatives are applied at local branch levels, local branches become more aware, more excited, and more engaged to increase SBA lending.

Engaged branches foster
more SBA lending

Benchmark
& COMPARE
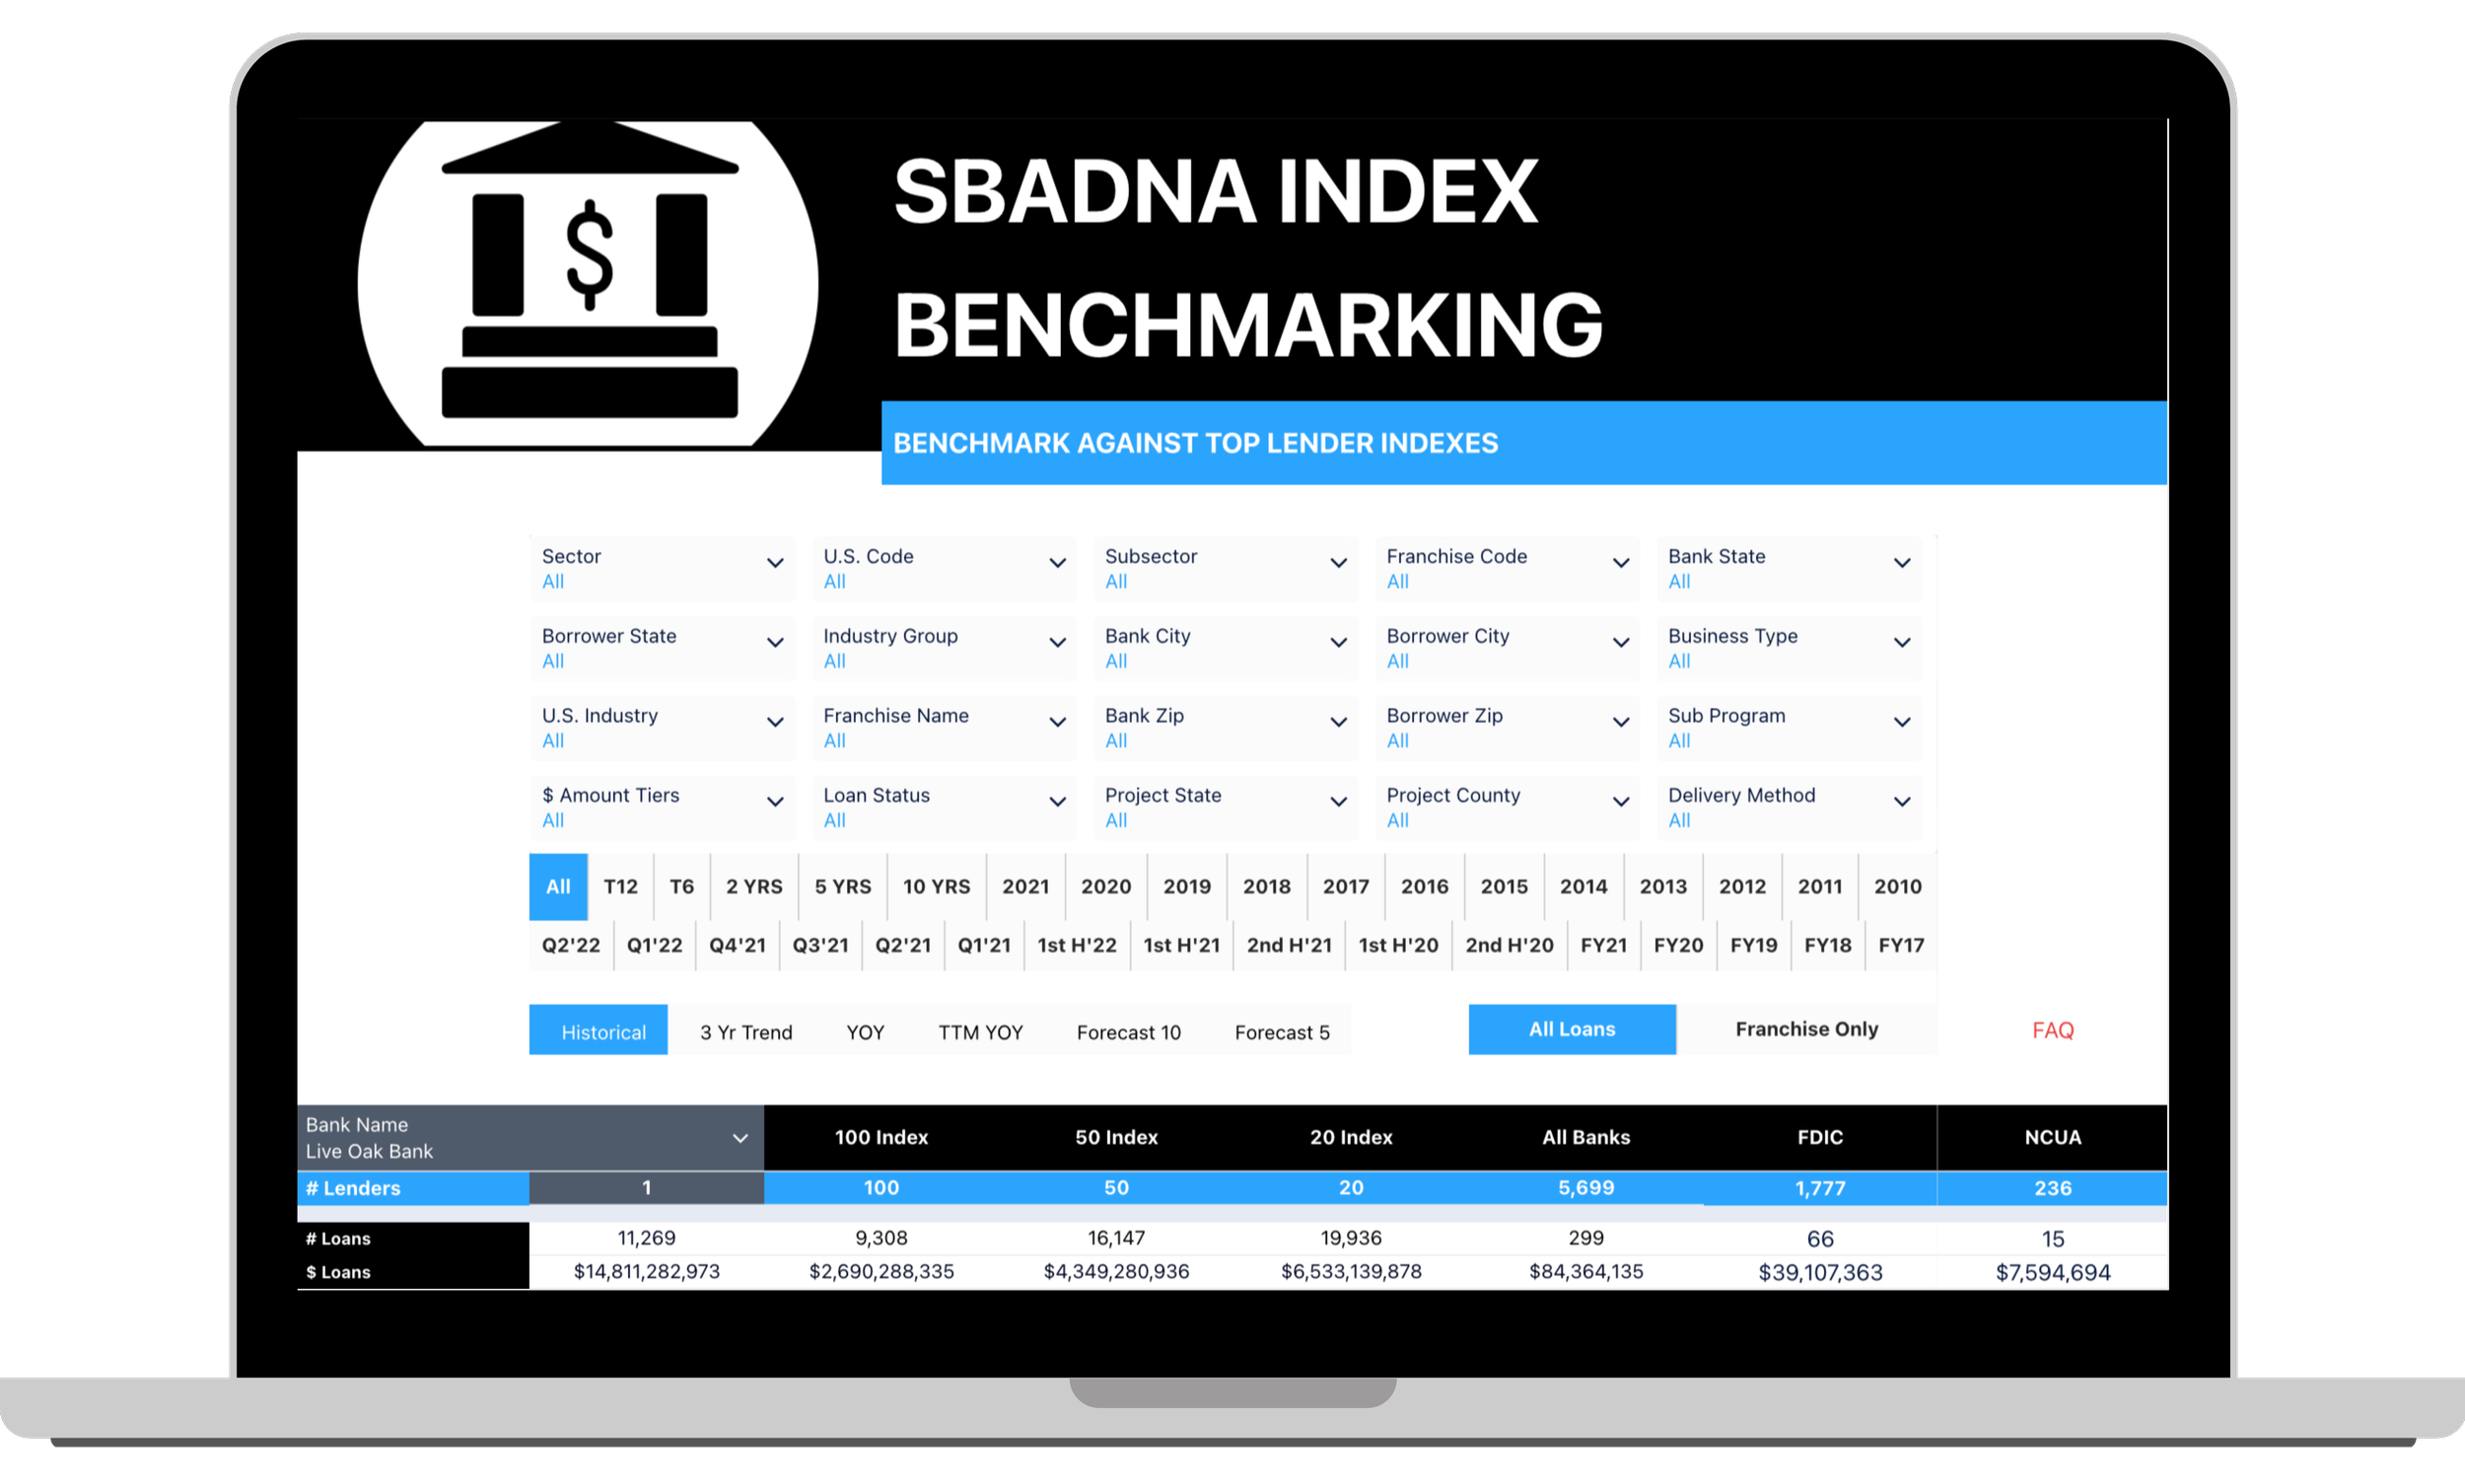
Benchmark SBA lending
Compare your bank with other SBA lenders, top lender indexes and all bank averages for any filter, location, and time period combinations.
Multiple filter combinations available to compare activity, industries, franchises, states, counties, cities, zip codes, and a host of other variables.

Compare in just a few clicks
See how your bank stacks up to other lenders, top lender indexes, and all bank averages for SBA 7(a) lending. Review all SBA activity, risk, trends, allocations, amount tiers, forecasts and more for:
- Lenders
- Industries
- Franchise Brands
- Geography
Compare two lenders SBA lending activity details side-by-side. Monitor and track changes with quarterly data updates.
COMPETITIVE INSIGHTS & INTEL
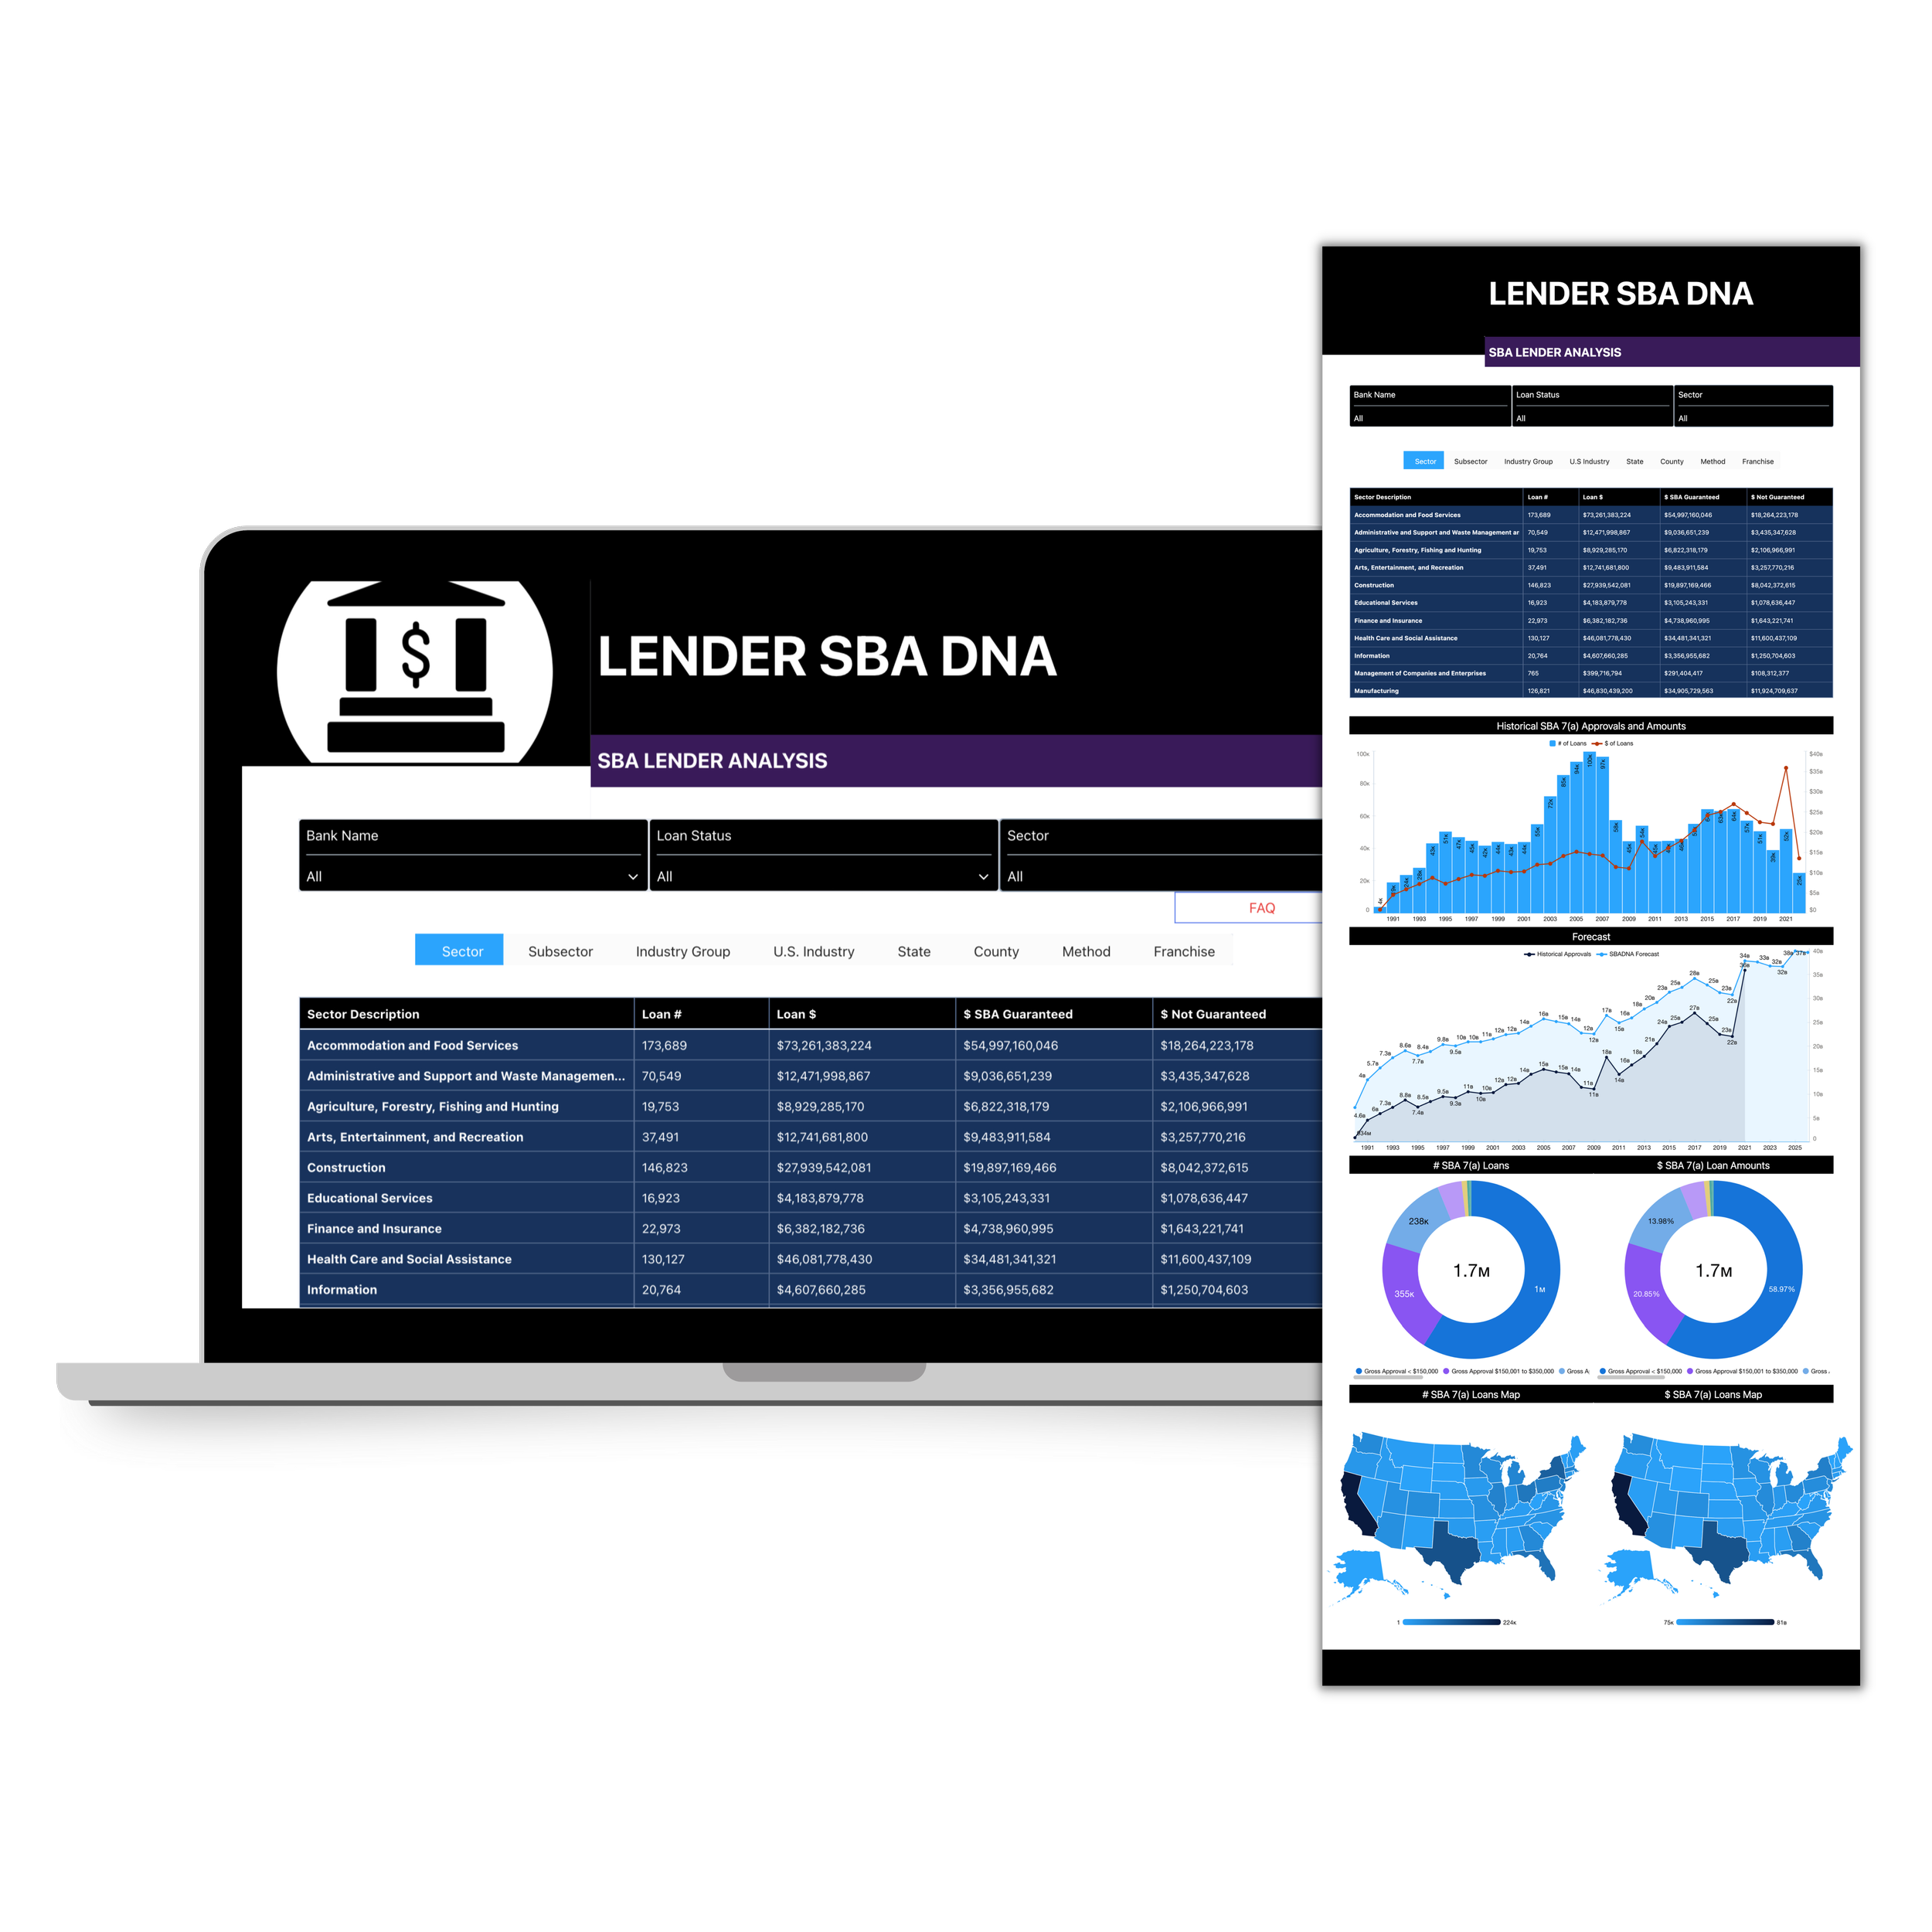
View SBA loan portfolios by industry, franchise and geographical allocations and risk exposure based upon multiple filter combinations.
ANALYZE ALLOCATIONS FOR ACTION

no training required
It’ s easy and intuitive to use.
Select the dashboard report, select any filters you want to use, and interact with the intel.