

BIG DATA TURNED INTO ACTIONABLE LENDING INTEL
GO FROM THIS:

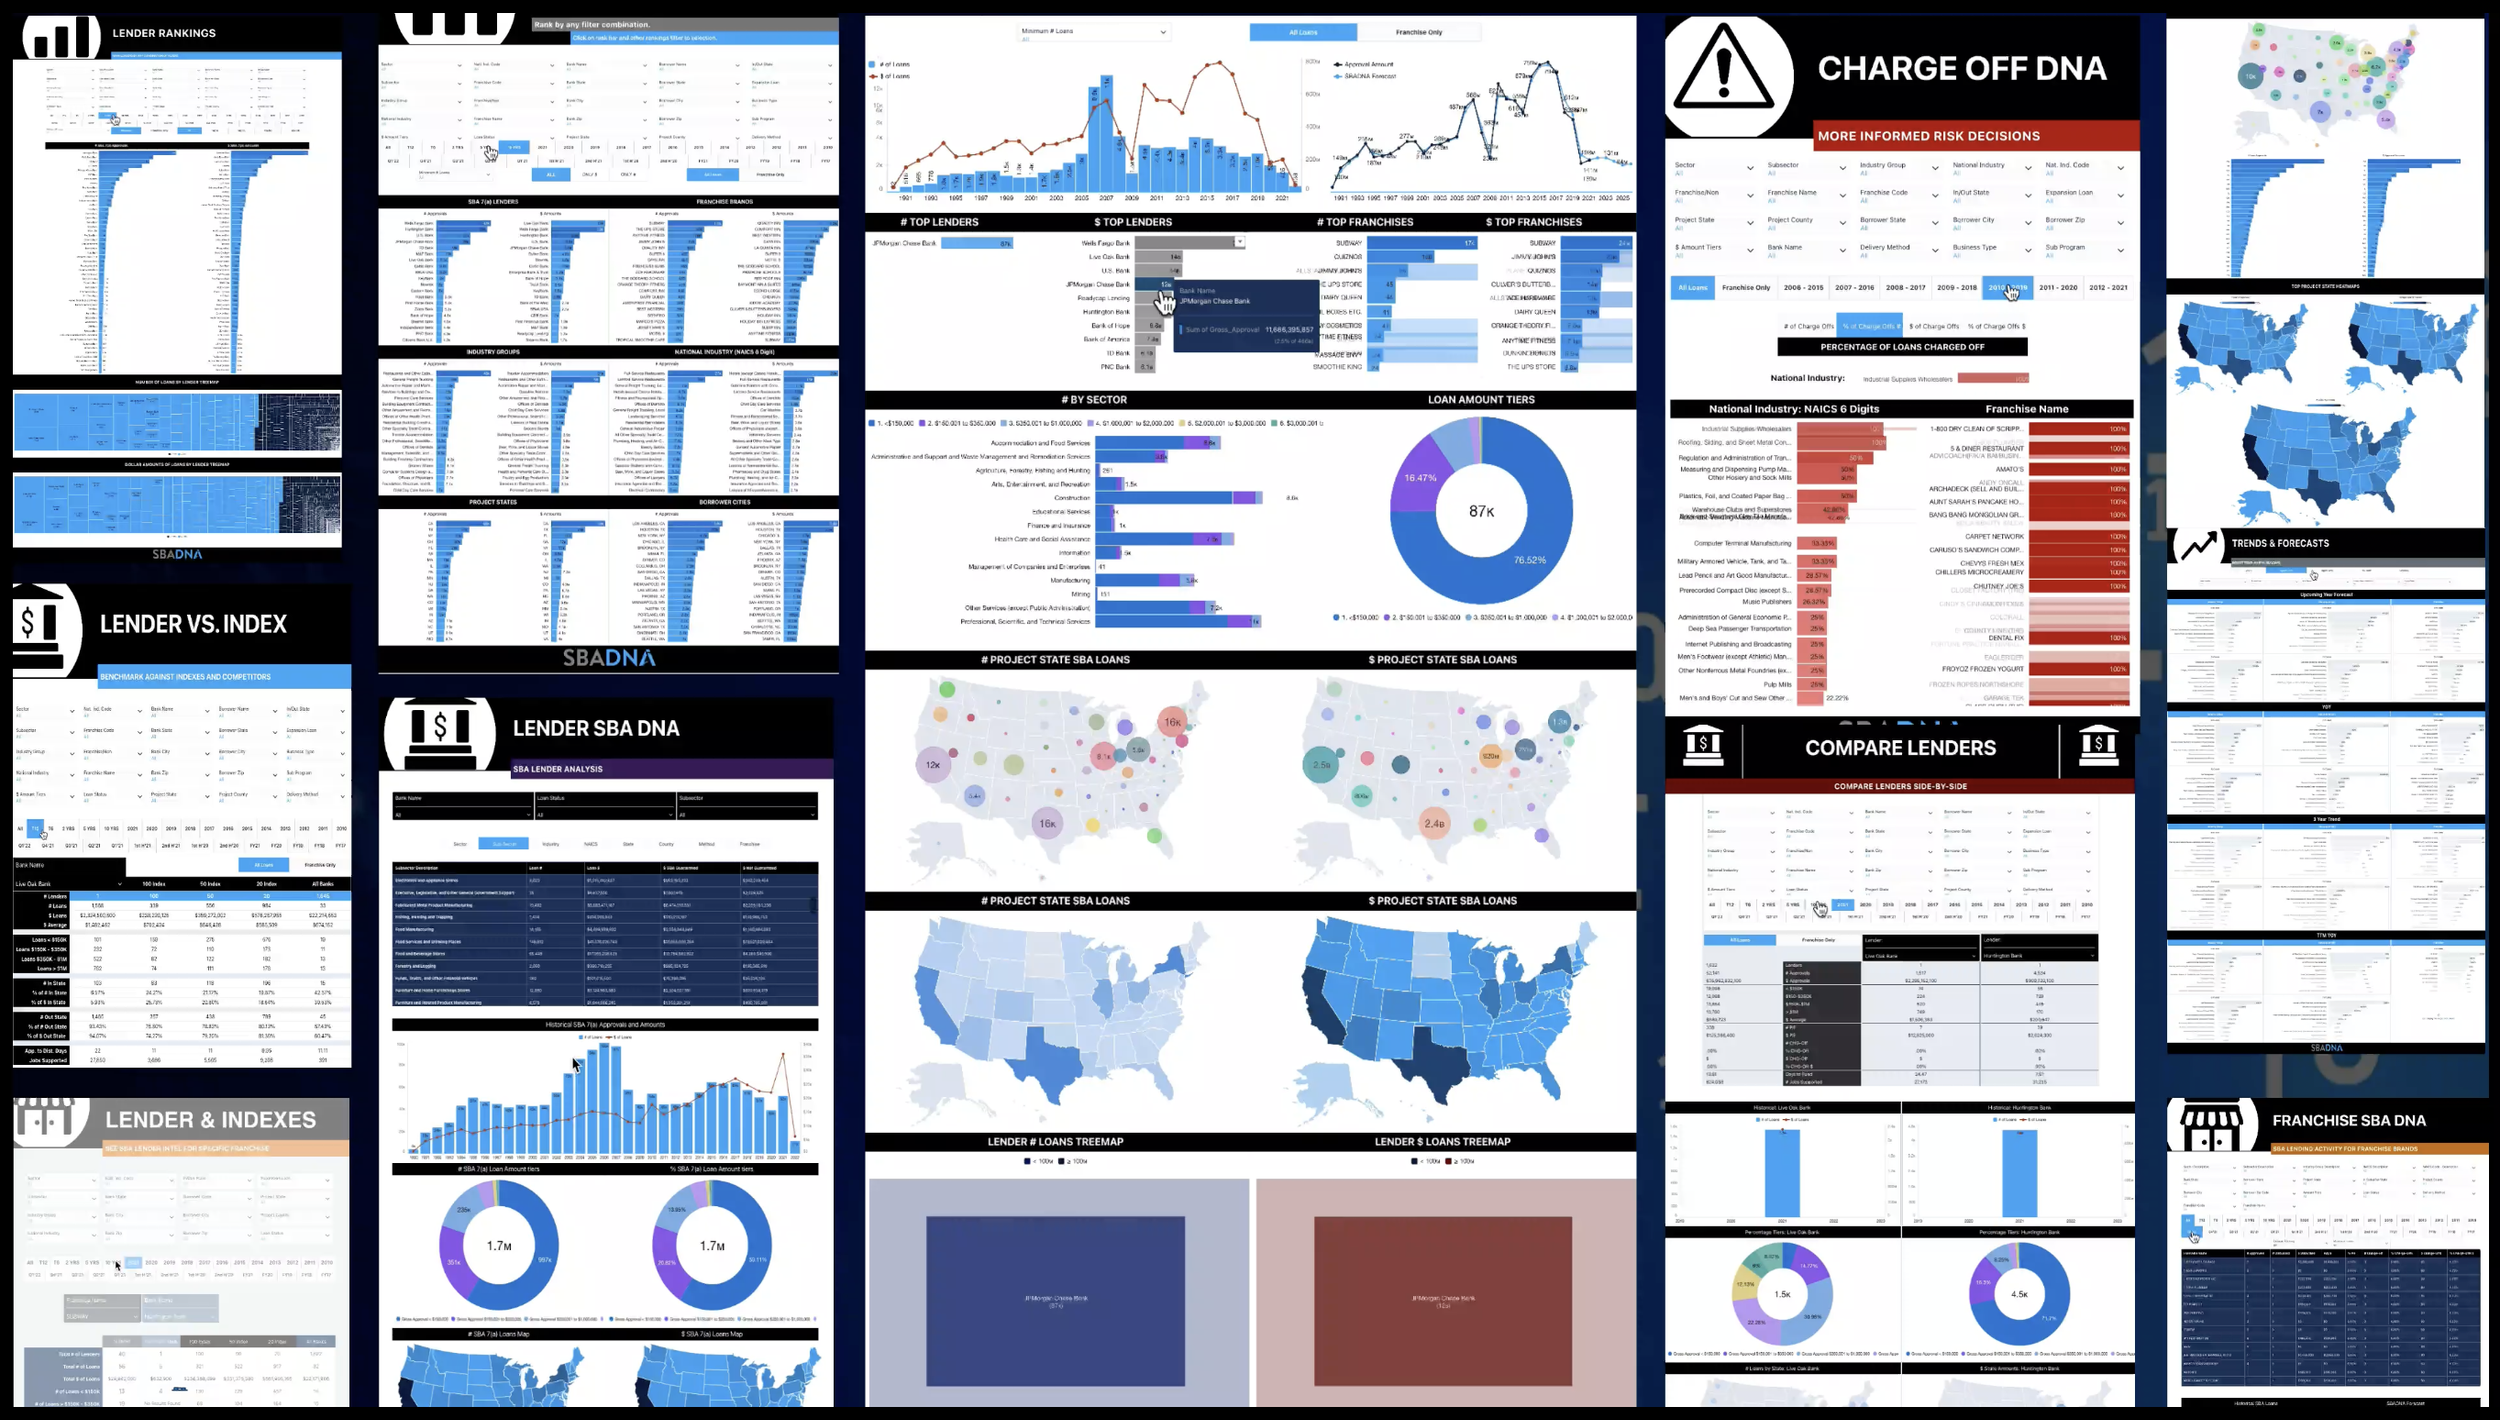
TO THIS:

Until today, finding quality lending intel was expensive and cumbersome - only to come up with a fraction of the big picture.
NOW IT’S AS EASY AS CLICKING A BUTTON TO ACCESS EVERYTHING.
SBADNA operates an advanced analytics platform focused on small business loans partially guaranteed by the U.S. Small Business Administration.
We provide free reporting to the public about some of our findings at www.SBAmatch.com. We sell user access to our proprietary SBADNA Intel Dashboards to banks, franchisors, data providers and others who benefit from our niche intel.
We import, clean, and convert SBA 7(a) FOIA data, historical Wall Street Prime Rate data, and NAICS code data into our advanced analytics platform. We built Intel Dashboards to make the intel easy to access and fun to interact with.

DATA SOURCE:


HIGH-LEVEL
REPORTING

Get organized macro summaries on relevant SBA intel that will help you make more informed decisions.
GRANULAR
INSIGHTS


Analyze specific micro insights on SBA lender activity, franchise trends, geographical rankings, and more through our interactive filtering tools.
(Click on Micro Insight Dashboards to Zoom)
FAST & INTUITIVE FILTERING
Find what you’re looking for quickly and easily with drop-down and one-click filters that are interconnected to provide a multitude of search combinations.
Scroll over the resulting interactive charts and graphs for pop-up info, and click to change the rest of the report to match your selection.
(Click Image to Zoom)
INTEL DASHBOARDS:
-
SBADNA is an advanced analytics platform that makes it easy and fun to interact with SBA lending intel. Click through each topic below for a better understanding of how our dashboard operates.
-
New loan data is retrieved every 3 months.
-
The original source of SBA loan data SBADNA collects (and continually updates) is initially derived from data released by the U.S. Small Business Administration (SBA).
-
As with most big datasets, the U.S. Small Business Administration (SBA) reported data is imperfect, relying on a bank representative to accurately input the data that the SBA then uses to make public through the FOIA (Freedom of Information Act).
The primary issues we have found with data integrity:
Erroneous data entry such as duplicates, typos, misspellings, and other entry errors.
A franchise loan can occasionally not be designated as such, or erroneously attributed to a different franchise with a similar name.
The 6 digit NAICS Industry code and description inputed may not be the exact code the borrower would attribute to their industry. This is why we added industry group, sub-sector and sector filters.
-
Usually when there is a discrepancy it is because of:
Time frame. SBA bases annual numbers on the SBA fiscal year which ends September 30th. We report for fiscal year, calendar year, trailing 12 months, quarterly, and will also generate reports for last 5 years, 10 years, 20 years and all-time.
Erroneous data. Other sources may not be cleaning duplicate and erroneous data that has been purged from the SBADNA database.
Loan status. Our dashboards allow for reports to be pulled by loan status where other sources may only show approved loans.
Franchise Insiders. Franchisors and franchise based associations and analytics firms have additional data they may report on specific franchise brands and sub-franchisees that may not be able to be captured through SBA data analytics alone.
-
We track short-term trends over 3 year periods and long-term trends over 10 year periods. Trends can be filtered for lender, industry, franchise, loan tier, and geography.
-
Our forecast model is based on Holt-Winters Forecasting model a.k.a. Triple Exponential Smoothing. The forecast is calculated as a weighted average of all historical data and recent data is weighted exponentially higher than older data.
This forecasting method is calculated on either additive or multiplicative components. The AI-powered dashboard internally calculates results by both algorithms and shows the best results of the two.
-
SBADNA focuses on the six digit NAICS industry code assigned to each SBA loan by the lender. This is a reported variable in the SBA FOIA datasets. We connected the first two digits of the six digit code to determine the Sector, the first three digits to determine the Sub-sector, and the first four digits to determine the Industry Group.
-
NAICS (pronounced “Nakes”) is the acronym for the North American Industry Classification System. NAICS describes NAICS codes this way on its website: “NAICS is a two-through-six-digit hierarchical classification code system, offering five levels of detail. Each digit in the code is part of a series of progressively narrower categories, and the more digits in the code signify greater classification detail.
The first two digits designate the economic sector, the third digit designates the sub-sector, the fourth digit designates the industry group, the fifth digit designates the NAICS industry, and the sixth digit designates the U.S. industry.
-
Franchise brands can be micro-filtered by franchise name and specific industry. Macro-filter any report by “Franchise Only” to filter for only franchise lending data. See franchise only, non-franchise only, or combined. Rankings, trends, forecasts, states and cities, and loan amount tiers can all be filtered for a specific franchise, group of like franchises, and all franchises, over any time period.
-
Filter by loan amounts, < $150,000, $150,001 to $350,000, $350,000 to $1,000,000, $1,000,001 to $2,000,000, $2,000,001 to $3,000,000, $3,000,001 to $4,000,000, and $4,000,001 to $5,000,000.
-
For each SBA lender our analytics shows the allocation of loans a lender has provided listed out for all sectors, sub-sectors, industry groups, U.S. industries, and franchise brands. Each of these categories can then be seen by loan status for charge-offs, PIF, cancelled, pending, and currently active loans. Each of these categories show the current portfolio allocation and the lender’s forecasted activity for that category.
-
Filter and track based on project state and county; borrower’s state, city, street address, and zip code; bank’s state, city, street address, and zip code.
-
Rank about anything in SBA lending for anywhere, over any time period, in any combination. Ranking combination filters include lender, industry, franchise, loan tier, and geography.
-
Get multiple perspectives of SBA 7(a) charge-off data. View the historical SBA 7(a) loan charge-offs by a combination of different filters. See charge-off data not only by industry and franchise brand, but also by combined filters such as loan amount tier, state, city, zip code, and time period. We report the number of charged-off loans, the dollar amount charged off, and the percentage of approvals and dollar amounts charged off. Time periods include ten year periods ending 2021, 2020, 2019, 2018, 2017, 2016 and 2015.